
Are you working in Sales, HR, BPO, Marketing, or Teaching and feeling stuck? You see the booming tech salaries, remote work, and growth in Data Analytics, but worry you lack a CS degree or coding background. Here is the truth: many successful Data Analysts come from non-IT backgrounds. In 2025, employers value problem solvers and domain experts as much as technical skills.
Why Data Analytics is the Best Switch for Non-IT Professionals
Data Analytics sits between business and technology, making it a strong fit for professionals who already understand domains like sales, operations, or finance. Compared to software engineering, it requires less intensive coding while offering clear pathways to impact and growth.
Low Barrier to Entry
If you can use Excel, you are already 10% there.
High Demand
Every industry from e-commerce to finance needs analysts who can turn data into decisions.
Transferable Skills
Domain knowledge gives you an edge in interpreting and acting on data.
Attractive Salary
Starting ranges typically fall between ₹4.5 LPA and ₹8 LPA, with rapid growth after 2–3 years.
The "Non-IT" Advantage (Your Secret Weapon)
Past experience is not wasted time. It is contextual knowledge that helps you ask better questions, find the right KPIs, and communicate actionable insights.
- Sales: You understand revenue, churn, and targets — valuable for forecasting and cohort analysis.
- BPO/Customer Support: You know customer pain points — ideal for feedback analysis and improving NPS.
- Finance/Commerce: Comfort with numbers accelerates learning SQL and dashboards.
Step-by-Step Roadmap: From Zero to Hired in 6 Months
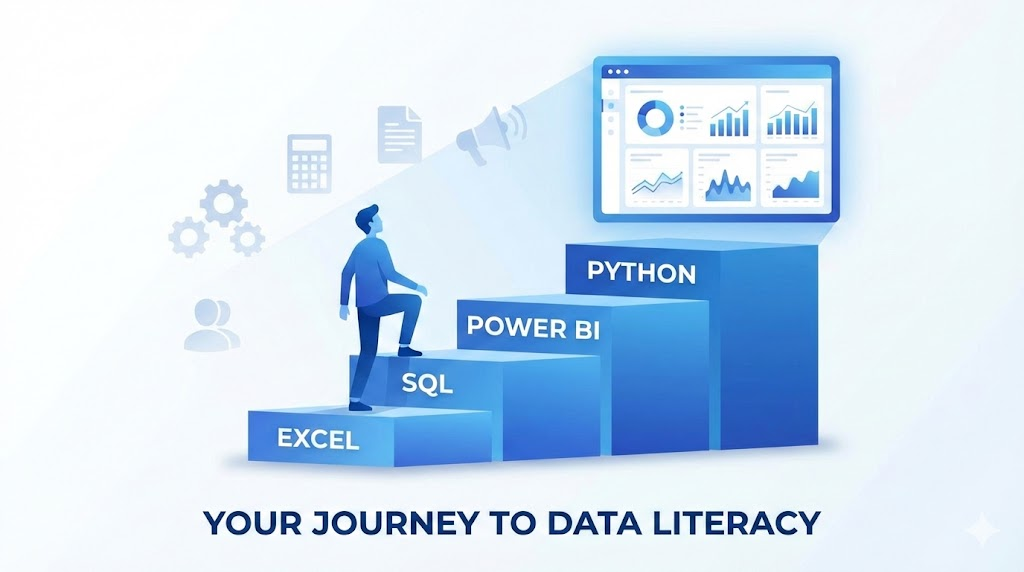
The goal is focus. You do not need every tool — you need the analyst toolbelt: Excel, SQL, Visualization, basic Python, and projects that show impact.
Month 1: Master Excel (The Foundation)
Excel remains ubiquitous and useful for quick analysis and reporting.
- Focus on VLOOKUP/XLOOKUP, Pivot Tables, Conditional Formatting, and data cleaning.
- Goal: turn a messy dataset into a clean, actionable report.
Month 2: SQL (Talking to Databases)
SQL is the most commonly tested skill in interviews and where real data lives.
- Learn SELECT, WHERE, GROUP BY, JOINS (INNER, LEFT), and CASE expressions.
- Practice on platforms like LeetCode/StrataScratch and with sample business datasets.
Month 3: Visualization (Power BI or Tableau)
Visualization turns analysis into decisions. Choose one tool and be fluent in it.
- Build interactive dashboards and learn fundamentals of chart selection and KPI design.
- Goal: create a Sales Dashboard a non-technical manager can use immediately.
Month 4: Python (Optional but Recommended)
Python is optional for many analyst roles, but it enables automation and handling larger datasets.
- Focus on Pandas, NumPy, and Matplotlib for EDA and simple automation scripts.
- If coding feels hard, prioritize Excel/SQL/BI first — they will get you hired for many roles.
Month 5 & 6: Projects & Portfolio
Employers hire evidence of impact. Projects show that evidence.
- Build 3 end-to-end projects: e-commerce sales analysis, customer churn exploration, and HR attrition dashboard.
- Host code on GitHub and dashboards on public links or a simple portfolio site.
- Optimize LinkedIn and resume using STAR-format examples that highlight transferable skills.
Bonus Tips for Career Switchers
- Highlight transferable skills: Show how prior work involved data, reporting, targets, or process improvements.
- Join communities: Engage in LinkedIn groups, local meetups, and problem-solving platforms.
- Get mentored: Structured guidance reduces wasted time and focuses you on interview-relevant work.
Common Myths Busted
Myth 1: I need to be a math genius.
Fact: You need arithmetic and logical thinking; advanced calculus is rarely required.
Myth 2: I need a 4-year degree.
Fact: Many employers value demonstrable skills and portfolios over formal degrees.
Myth 3: It takes years to learn.
Fact: With a structured plan and consistent practice (2 hours/day), you can be job-ready in 4–6 months.
Salary Potential (India, 2025)
Entry-level salaries typically range from ₹4.5 LPA to ₹8 LPA. With 2–3 years of experience and demonstrable impact, analysts commonly reach ₹12–15 LPA or higher depending on industry and location.
How LBA Analytics Accelerates Your Switch
Self-learning is possible but often inefficient. LBA focuses on practical, job-focused training that aligns with what hiring teams ask for.
- 1:1 Mentorship: Personalized guidance to stay focused and interview-ready.
- 1:4 MentorshipEnd to End Training for Career Transition with your 3 more peers and 1 Mentor.
- No-Code First Approach: Learn logic before syntax to build confidence quickly.
- Live Projects: Work on real company datasets rather than contrived exercises.
- Placement Support: Resume rewriting and interview preparation that highlights transferable experience.
“At LBA Analytics and AI, we don’t just train Data Analysts—we create Data Champions.”
Start your Data Analytics journey today — your next six months can change your next six years.
Ready to start Month 1?
Join our upcoming batch for the exact syllabus, hands-on projects, and mentorship you need to make the switch.
Book Free Trial Class